Injection Moulding Expertise: A Question of Class
Comparing or specifying injection moulding machines using only brochure data is difficult, as manufacturers measure under different conditions and specify different parameters, making comparisons like comparing apples and oranges. In this expert article from Arburg, Dr Eberhard Duffner demonstrates why performance is not always performance, but physics is always physics.
Which injection moulding machine is the right one for which application? Is fast also powerful – and at what price? Anyone trying to answer these questions by comparing brochure data will be disappointed. This is because different manufacturers sometimes measure under different conditions and specify parameters so different from each other – it is like comparing apples and oranges. In addition to injection volume and speed, filling time and component weight are also crucial factors when selecting a machine. Below we will demonstrate why performance is not always performance, but physics is always physics.
What this means can be illustrated using the example of a car driver: suppose someone wants to drive over the Alps on holiday. A powerful SUV, a sporty convertible and a tandem trailer are available. Both vehicles have roughly the same power output of 250 kW, i.e. around 350 hp. Which of the two vehicles will drive in a relaxed manner over the Alps to the destination, and which one would it be more fun to cruise through the various passes in? Should the driver load the SUV onto the trailer and drive the sports car to the destination – or would the other way around be better, so as to enjoy the bends of the landscape in the convertible? This is a decision that everyone will probably make intuitively in the same way.
If we transfer this analogy to the forming process world of injection moulding, the answers are not particularly clear at present. One reason is the change in drive technology and in suppliers, who are increasingly coming from the machine tool sector. As a result, the injection speed for the injection axis is specified in some cases linearly in mm/s, and in others volumetrically in cm3/s. Other conventional brochure data relates to screw diameter, shot volume and injection pressure. Recognised substantiated values are those which are actually achieved under full load at 2000 bar counter pressure and 1 D screw stroke. Most (European) moulds and screws are also adapted to this mechanical load.
Brochure data for a comparison of machines
Footnotes in the technical data sheets that quote “theoretical” idle speeds without the pressure factor or with limited holding pressure times are less significant. Whether such theoretical values in the brochure or on the control system screen are actually sufficient to realise the desired injection times with the machine in the actual process cannot be deduced from this.
For example, a “theoretical” idling speed of 1,000 mm/s simply means: according to the datasheet, the motor can rotate fast enough that the specified speed is theoretically achieved over the entire screw stroke – but without taking into account the counter-pressure in the mould, into which the plastic does not “voluntarily” flow. The faster the injection, the higher the counter pressure and consequently the pressure required for injection. In addition, it is of course not possible to drive into the holding pressure at full speed because the mould would inevitably become completely overloaded if there was no slowing down. This value is therefore never reached in the actual process.
Hydraulic versus electric injection units
Modern hydraulic injection units require relatively little superimposed system pressure in order to be able to use the full injection pressure (2000 bar) at maximum programmed speed. At least that is how current datasheets for hydraulic injection units are designed. For fast and precise injection, hydraulically driven injection units are usually equipped with a servo valve and barely differ in terms of dynamics. While stored energy and high peak performance can be used here, the performance required for electric drives is always supplied directly from the mains to the injection axis and screw tip. In addition, with commercially available hydraulic injection units, the inertial mass of the construction plays virtually no role, in contrast to electromechanical solutions.
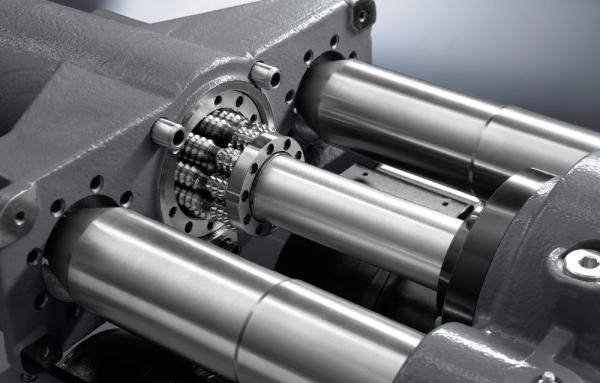
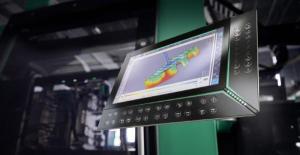
Intrinsic inertia is another crucial factor in electro-mechanical systems. This needs to be overcome in order to accelerate the drive components spindle or gearbox and servomotor to the required final speed. As a rule, at least 50 % of the installed drive power and the available torque must be used for this purpose. The dynamics of servo-electric direct drives depend heavily on mechanical design. Arburg develops and manufactures its own planetary roller screw drives for its Alldrive and Hidrive series machines, which are particularly load-resistant and durable (Title image).
Without getting lost in technical details, the mechanical design and the construction principle and consequently the target design play a key role in electric injection units. The dynamics and peak performance that can be achieved with these machines have a significant influence on the machine price and the technical possibilities in the injection moulding process. Or to stay with the analogy mentioned at the beginning: an 800-kg sports car that needs to get a trailer with a 2.5-ton SUV moving can no longer accelerate from 0 to 100 km/h in 3 s. That is, if it can even still pull it on a 15 % incline without the wheels spinning.
All good things come in threes – different performance classes
Based on the filling time, the applications and injection moulding machines suitable for them can currently be roughly divided into three classes (Table 1). The majority of all applications are technical injection moulded parts with a filling time of 0.3 s and well above. Directly driven hydraulic standard machines are generally designed and ideally suited for this area. Applications with extremely short filling times of less than 0.1 s are more of a niche for specially adapted injection moulding machines, which by no means every manufacturer offers. These include, for example, thin-walled high-temperature components made of PEEK for the classic consumer goods and electronics industries. One example is charging plugs for smartphones.

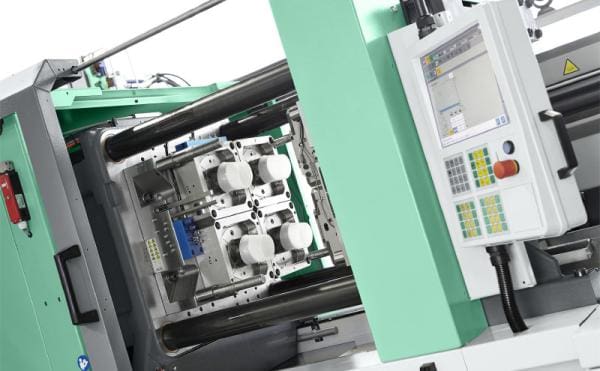
Classic applications with filling times of approx. 0.1 to 0.3 s here are the processing of polyolefins into thin-walled packaging parts such as cups (Fig. 1) buckets or screw caps with flow path to wall thickness ratios of 100 to 300:1. Such thin-wall applications require high dynamics. Therefore, hydraulic machines with hydraulic accumulator technology have been used to a large extent in this segment up to now. However, the trend here is also towards directly driven electric or hybrid high-performance machines. This is where the wheat is separated from the chaff because the term “high performance” is elastic and relative.
Three-dimensional thinking: screw size as an influencing factor
The achievable injection speed in mm/s is one of the characteristic indicators of the technical performance of an injection moulding machine. The use of mm/s actually comes from the machine tool industry, which describes the linear feed rate of an axis. In the dimension of km/h, this approach is a suitable SI unit for the maximum achievable movement speed of a motor vehicle, but not for injection. The situation here is fundamentally different. This is because the machine’s injection unit does not fill in millimetres, but injects a volume in the form of a fluid plastic melt into the mould cavities. This is where the screw size comes into play (Fig. 2).
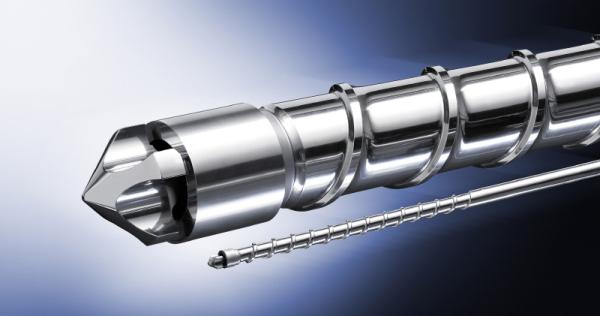
The same injection moulding machine can be equipped with different screws. At the same feed rate, this results in different flow volumes per unit of time until the required volume has been injectefd. In addition, in Europe diameters are usually graduated in 5 mm steps, i.e. 25, 30, 35 mm, etc. Other manufacturers prefer a standard series with diameters of, for example, 28, 32 and 46 mm, so a direct comparison, in terms of process capability, based on feed rate alone is not meaningful.
Filling time parameter
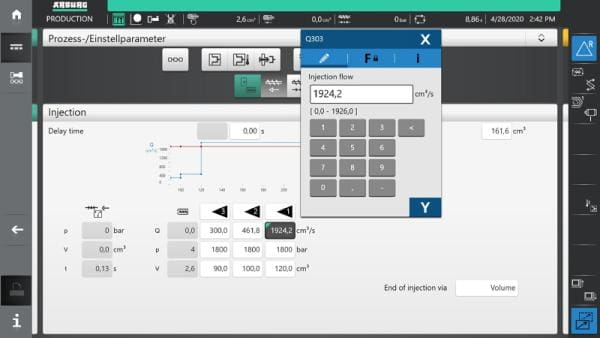
What is ultimately relevant for the respective practical application is the volume of plastic melt that can be injected per unit of time, i.e. the time during which the “cake is baked” before the material solidifies. This filling process is characterised by the filling time, on which filling simulations are also based. The relevant variable is therefore the injection volume per unit of time, known as the injection flow volume (Q). Ever since the development of the first control systems at the end of the 1970s, Arburg has been specifying the associated injection moulding physical unit as the injection flow volume in cm3/s and has been using this as a data sheet parameter for decades. A milestone in more recent times was the introduction of the Gestica control system in 2016 (Fig. 3).
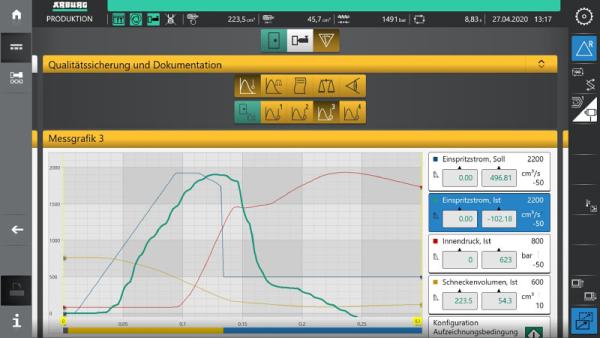
The data for a filling simulation can also be transferred to this. A filling simulation can be done directly on the screen with the help of the “aXw Control FillAssist” function (Fig. 4).
Most machines can operate with a maximum screw stroke of 3.5 to 4.5 D, but this is only relevant for thick-walled components and for filling times in the seconds range. Particularly in the thin-wall sector, around 1 D of screw stroke can usually be used as injection volume with common three-zone screws and a usable throughput design. The filling time, which is achieved in the injection moulding process with 1 D screw stroke, is therefore a great classification feature, irrespective of the abundance of materials and the width of the part spectrum. During this time, more than 95 % of the liquid plastic melt must have been injected into the mould by the injection unit.
For the filling process, the crucial factor for the given injection unit and the machine is how much melt volume arrives in the mould during the available filling time. This constitutes another reason to state the injection flow volume in cm3/s instead of the feed rate in mm/s in data sheets relating to plastics (Fig. 5).
This value is therefore standardised with the corresponding screw diameter and can be easily calculated in your head for a desired plastic part: assuming a density of 1 g/cm3, a part volume of 50 cm3 and a required filling time of 0.1 s. This initially results in an injection flow volume of at least 500 cm3/s. With electric drives, which have to be accelerated and actively braked with not inconsiderable inertial masses, this value must be multiplied by a factor of 2 (triangular operation). So in this case the value in the datasheet suitable for this application – without a footnote – should be around 1,000 cm3/s.
Injection flow volume versus feed rate
If it’s been a while since GCSE physics for you: for a given feed rate and screw diameter (converted into cm), the injection volume flow can be calculated as follows:
Q = Pi × ¼ D2 × v
Q = Injection flow volume (cm3/s)
Pi ~ 3.14
D = Diameter (cm)
v = Velocity (cm3/s)
If the feed rate is, for example, 200 mm/s (= 20 cm/s), the following injection flows result for screws with diameters of 35 and 28 mm:
- 35 mm: 3.14 × ¼ x 3.52 cm2 x 20 cm/s = 192.33 cm3/s
- 28 mm: 3.14 x ¼ x 2.82 cm2 x 20 cm/s = 123.09 cm3/s
In order to also achieve an injection flow volume of 192 cm3/s with a 28 mm screw, the feed rate would have to be 313 mm/s instead of 200 mm/s – around 1.5 times that of the 35 mm screw. Conclusion: the smaller the screw, the higher the feed rates [mm/s] required to inject the same volume of liquid plastic melt [cm3/s].
In order to estimate which injection unit is suitable for the respective application, the filling time, the part or shot weight and, if necessary, the material density should be known. For this reason, almost every injection moulding engineer has a small spring scale in their pocket. This is because, in contrast to the specific weight of the plastic melt, the actual weight of the cured component can be easily determined. By rule of thumb, this can be equated with the volume to be injected at a density of 1 g/cm3 (e.g. for polyolefins) in order to roughly estimate the suitability according to the datasheet (the exact calculation according to the PvT diagram is carried out by the control system in modern machines).
Selection of the appropriate injection unit
Again, a simple calculation example: assume that a ballpoint pen to be produced weighs 5 g. Multiply this component weight by the number of cavities (e.g. 8) and add the sprue weight (e.g. 30 g). In the example, this results in a shot weight of 70 g. A filling time of 0.5 s results in an injection flow volume of around 70 cm3 in 0.5 s, which corresponds to around 2 x 70/0.5 = 280 cm3/s for electric drives according to the above rule of thumb. Now it is easy to see from the technical data sheet which injection unit achieves a shot volume of 70 cm3 and an injection flow volume of at least 280 cm3/s with a 1D screw stroke. In this way, the suitable injection unit can be determined in an uncomplicated manner. However, you will need to use a calculator if the brochure indicates speeds in mm/s instead of injection flows.
Euromap: Standardised injection unit sizes
The designation for injection units proposed in accordance with Euromap 1 has become established as a near-standard datasheet. This is the product of the maximum stroke volume in cm3 and the maximum spray pressure in kbar. This classification number is then also used for price/performance comparisons. Example: An injection unit 800 according to Euromap has, in many cases, a screw diameter of 50 mm, a stroke of 200 mm and a maximum injection pressure of 2000 bar.
Given that stroke is more cost-effective than force for electric drives, various manufacturers use smaller screw diameters for a given Euromap index. The consequence of this is that, in accordance with the square area ratio, more stroke, L/D ratio and correspondingly higher feed rates need to be realised in order to obtain the same part in the mould for a given injection volume and filling time. For a thin-walled application with, for example, a shot volume of 100 cm3 (approx. 1D stroke) and a filling time of 0.2 s, a flow volume of max. 1000 cm3/s is calculated in triangular operation. With a 50 mm screw, a corresponding feed rate of 510 mm/s would be achieved, whereas with a 45 mm diameter it would be 630 mm/s. Although this approx. 23 % increase looks better on the datasheet, they are both identical in terms of process technology.
Top performance at the tip of the screw
Unfortunately, the effective performance designation for injection units specified in Euromap 4 has not become established in the datasheet specifications because the actual movable peak performance at the screw would be a parameter that would also be reflected in the price, at least for directly driven injection units.
The following applies to performance:
L = P/10 × Q
L = performance (W)
P = pressure (bar)
Q = injection flow volume (cm3/s)
In the above example, this is 200 kW regardless of the screw diameter. In order to produce this peak performance at the tip of the screw, the entire system must first accelerate. As mentioned, the design plays a key role in direct electric drives.
This is where GCSE physics comes into play again, and with it Newton’s laws of inertia. To accelerate the inertia, all technical designs known today require additional forces corresponding to 0.5 to 1 times the load force. So with the thin-walled application above, 400 kW peak motor performance is reached quickly. This is where the holiday example mentioned at the beginning comes into play and the question of which combination really makes sense.
With a smaller screw and consequently a smaller surface area, less force needs to be applied for the same pressure. There is also the question of whether the maximum pressure can also be used over the entire injection phase. Pure thin-walled injection units, which are only designed for short filling times and peak performance, are less suitable for filling times of 10 s, such as those required for a thick-walled optical component. Here it would start to oscillate or overheat due to the injection and holding pressure that has to be maintained for a long period of time – similar to the convertible car that is stuck in a traffic jam at the pass with the clutch dragging.
The question of how much mechanical performance actually reaches the tip of the screw at the required speed is therefore particularly interesting. And in the case of thin-walled applications, also how dynamically or statically this performance can be driven. In the case of the proven hydraulic injection units, the accumulator technology has been developed over many years together with very low-inertia servo valves. For the above example, only around 20 kW of continuous charging power would be required here. For modern electric direct drives, there are indeed some technological attempts to solve the problem of peak performance via mechanical or electrical intermediate energy storage. However, only the solution of using the “supply network” for this purpose has really become established to date. This extra performance has an effect on the cost of electric drives and they are in a whole different price range. Moreover, above a certain size, the inertia really “eats up” the peak performance, which is why the electric injection units are not built in all sizes, at least not yet (Fig. 6).

In spite of all these challenges, there is a trend toward going electric even with classic permanent orders with filling times in the range of 0.1 to 0.3 s (packaging applications). Here, figuratively speaking, it means not only climbing a pass with a heavy trailer but driving hundreds of thousands of kilometres with it.
Conclusion
The shot volume and the filling time are relevant for injection. The associated indicator is the injection flow volume in cm3/s – regularly measured at 2000 bar counter pressure. The injection flow volume can be easily calculated from the application and a suitable injection unit selected by rule of thumb according to the data sheet. There is no data sheet on how electric injection units are designed. Nevertheless, the question of what class is required is also important. Should the machine be designed more for continuous performance or for peak performance? Because both at the same time makes no sense.
About the author

Dr. Eberhard Duffner (Fig. 7) began his career at Arburg in October 1986. From July 1990 to December 2020, for three decades the doctor of physics headed the development department and played a key role in shaping injection moulding technology at Arburg. In May 2012, he was “knighted” by the VDI (Association of German Engineers) for his extensive knowledge of plastics technology and was accepted into the close-knit circle of strategy and experts.
Arburg
01926 457000
Website
Email


